The mental health provider shortage is worst in West Virginia, Delaware, and Arizona, where the federal government estimates that less than 11% of the need for mental health providers is being met (HRSA Designated HPSA Quarterly Summary, as of December 31, 2025). Nationally, designated shortage areas meet just 27.3% of need, and 137 million Americans live inside one.
Quick answer: As of December 31, 2025, the states meeting the smallest share of their mental health workforce need are West Virginia (5.7%), Delaware (7.0%), Arizona (10.1%), Alaska (12.2%), North Carolina (12.5%), and Tennessee (13.3%), per HRSA. The states meeting the most are New Jersey (52.3%), Utah (50.8%), and Rhode Island (48.9%). The raw gap is largest in Texas, California, and Florida, which together need more than 1,700 additional practitioners to lift their shortage designations.
Key takeaways
- Seven states meet under 15% of their designated mental health workforce need: West Virginia, Delaware, Arizona, Alaska, North Carolina, Tennessee, and Maine (HRSA, December 2025).
- Nationally, 6,807 shortage-area designations cover 137 million people and meet 27.3% of need.
- By raw headcount, Texas (606 practitioners short), California (598), and Florida (545) have the largest absolute gaps.
- “Provider present” and “care reachable” are different measures. Some states with better workforce supply rank worse on actual access once insurance and cost are counted.
This is the state-level view. For the national picture and why the shortage keeps growing, see 137 million Americans live in a mental health desert. For the psychiatrist-specific projection through 2037, see the coming psychiatrist cliff.
How to read these numbers
A Mental Health Professional Shortage Area (HPSA) is a federal designation. HRSA assigns it when a geographic area, population group, or facility has too few mental health providers relative to its population. “Percent of need met” is the metric that ranks how bad each state’s shortage is: HRSA divides the providers available inside a state’s designated shortage areas by the number that would be required to lift those designations. A state at 10% of need met has roughly one in ten of the providers its designated areas would need to stop counting as shortage areas.
One caveat matters before ranking anything. These figures describe the designated shortage pockets inside a state, not the statewide average. That is why the District of Columbia, which is provider-dense overall, shows 0% of need met inside its designated areas: the designations there target specific underserved populations and facilities, and those pockets have essentially no dedicated supply. Read the percentages as a measure of how deep the shortage runs where the shortage has been formally identified, not as a report card on the whole state.
The states where the shortage is worst
By percent of need met, these eleven states are meeting the smallest share of the demand inside their designated shortage areas (HRSA, as of December 31, 2025):
| State | Percent of need met | Shortage designations | Practitioners needed to lift designations |
|---|---|---|---|
| West Virginia | 5.7% | 124 | 94 |
| Delaware | 7.0% | 13 | 47 |
| Arizona | 10.1% | 213 | 144 |
| Alaska | 12.2% | 338 | 22 |
| North Carolina | 12.5% | 218 | 256 |
| Tennessee | 13.3% | 97 | 252 |
| Maine | 14.4% | 66 | 11 |
| New York | 15.2% | 200 | 238 |
| Missouri | 15.2% | 263 | 114 |
| South Dakota | 18.0% | 63 | 37 |
| Kansas | 18.7% | 114 | 52 |
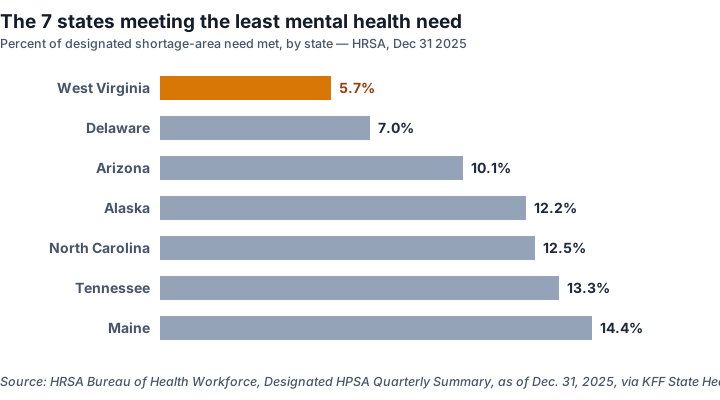
Puerto Rico sits below all of them at 8.3% of need met across 74 designations. Several Pacific territories, including Guam and the Northern Mariana Islands, register at 0%.
The list crosses every regional stereotype. Rural Appalachia (West Virginia) and the rural Plains (South Dakota, Kansas) are there, but so is a dense Northeastern corridor (Delaware, New York) and a fast-growing Sun Belt state (Arizona). The shortage is not a rural problem that stops at the city line. It tracks where the economics of practicing have broken down, and those economics are set by payers and Medicaid rates that do not respect geography.
The states meeting the most need
At the other end, these states meet the largest share of their designated need (HRSA, December 2025):
| State | Percent of need met | Shortage designations | Practitioners needed |
|---|---|---|---|
| New Jersey | 52.3% | 42 | 34 |
| Utah | 50.8% | 62 | 81 |
| Rhode Island | 48.9% | 15 | 21 |
| New Hampshire | 48.2% | 21 | 4 |
| Georgia | 45.3% | 92 | 174 |
| Nebraska | 44.5% | 91 | 30 |
Even the best-performing state in the country, New Jersey, meets barely half of the need inside its shortage areas. “Best in class” here means a coin flip. There is no state where a designated shortage area is close to fully staffed.
Where the raw gap is biggest
Percent of need met tells you how deep the shortage runs. It does not tell you how many actual clinicians are missing, because a small state can post a terrible percentage while needing only a handful of people. The absolute gap looks different.
By the number of additional practitioners required to lift every designation, the largest shortfalls are:
- Texas: 606 practitioners across 393 designations
- California: 598 practitioners across 627 designations (the most designations of any state)
- Florida: 545 practitioners across 239 designations
- Illinois: 301, North Carolina: 256, Tennessee: 252, Ohio: 247, New York: 238
Alaska is the instructive counterexample. It carries 338 shortage designations, the third-most in the country, and meets only 12.2% of need, yet it needs roughly 22 additional practitioners to clear them, because the designated populations are small and scattered. A single statewide headline number hides two very different problems: depth of shortage and volume of shortage. West Virginia has depth. Texas has volume. They require different fixes.
”Provider present” is not “care reachable”
HRSA’s data answers one question: do enough providers physically exist near a given population. It does not answer whether those providers take your insurance, are accepting new patients, or charge a rate you can afford. Those are separate failures, and they scramble the rankings.
Compare HRSA’s supply measure with Mental Health America’s 2025 Access to Care ranking, which folds in insurance coverage, cost barriers, and workforce. New York meets only 15.2% of its designated workforce need, one of the worst supply figures in the country, yet ranks 8th of 51 for access, because insurance coverage there is broad. Texas meets 32.2% of need, a middling supply figure, yet ranks dead last (51st) for access, because coverage and cost barriers are severe (Mental Health America, State of Mental Health in America 2025). Alabama (50th) and South Carolina (49th) round out the bottom.
The lesson for anyone searching “how bad is the therapist shortage in my state” is that two different numbers can both be true and point in opposite directions. A provider on the map is not an appointment you can get. Nationally, 1 in 4 adults with a mental illness reported an unmet need for treatment in 2022–2023 (Mental Health America). That gap is not only a headcount problem. It is a reimbursement and coverage problem sitting on top of a headcount problem, which is the harder thing to fix and the thing the raw shortage maps tend to hide. For the mechanics of how underpayment and prior authorization drive clinicians out of the workforce in the first place, see the national shortage breakdown.
The one lever that is genuinely state-addressable
There is a reason states track HPSA designations so closely. The designation is also a funding key. It determines eligibility for National Health Service Corps loan repayment and scholarship placements, and it triggers a federal bonus payment for clinicians who practice inside the shortage area. A state that wants to move its percent-of-need-met number has real tools: target loan repayment and incentive dollars at its lowest-served designations, expand the licensed workforce, and use telehealth licensing reciprocity to import supply into the pockets that need it.
None of that touches the deeper driver, which is a payment system that makes serving these populations financially punishing in the first place. But at the state level, the designation data is the map. West Virginia at 5.7%, Delaware at 7.0%, and Arizona at 10.1% are not abstractions. They are the places where the federal government has already documented, on the record, that the providers are not there.
FAQ
Which states have the worst mental health provider shortage? By HRSA’s percent-of-need-met measure, as of December 31, 2025: West Virginia (5.7%), Delaware (7.0%), Arizona (10.1%), Alaska (12.2%), North Carolina (12.5%), and Tennessee (13.3%). Nationally, designated shortage areas meet only 27.3% of the need for mental health providers.
What does “percent of need met” mean for a mental health HPSA? HRSA divides the mental health providers available inside a state’s designated shortage areas by the number required to lift those designations. A figure of 27.3% nationally means designated areas hold about a quarter of the providers they would need to no longer count as shortage areas. It describes the designated pockets, not the state’s overall provider density.
Which states have the biggest mental health workforce gap? By raw headcount, Texas needs 606 additional practitioners to lift its designations, California 598, and Florida 545, driven by population size. Alaska holds 338 designations but needs only about 22 more practitioners, because its designated populations are small.
How do I find out how bad the therapist shortage is in my state? HRSA’s Designated HPSA statistics at data.hrsa.gov and KFF’s State Health Facts both publish per-state figures. Read percent of need met as the supply picture inside designated pockets, then pair it with an access measure like Mental Health America’s ranking, which counts insurance and cost.
Does having providers nearby mean I can get an appointment? No. HRSA measures whether providers exist near a population, not whether they take your insurance or are accepting patients. New York meets only 15.2% of its workforce need yet ranks 8th for access; Texas meets 32.2% yet ranks last. A provider on the map is not a reachable appointment.
Sources
- KFF State Health Facts, Mental Health Care Health Professional Shortage Areas (HPSAs) — full state-by-state table: designations, population, percent of need met, and practitioners needed. Sourced to HRSA Bureau of Health Workforce, Designated HPSA Quarterly Summary, as of December 31, 2025. Supports every per-state and national figure in this article (national totals: 6,807 designations, 137,133,953 population, 27.3% of need met, 6,800 practitioners needed).
- HRSA Bureau of Health Workforce, Designated Health Professional Shortage Areas Statistics — the underlying federal quarterly HPSA dataset from which the KFF figures are drawn. Data as of December 31, 2025.
- Mental Health America, The State of Mental Health in America 2025 — 1 in 4 (25%) of adults with any mental illness reported an unmet need for treatment (2022–2023). Access to Care ranking (best: Vermont, Maine, Massachusetts; worst: Texas 51st, Alabama 50th, South Carolina 49th; New York 8th). Published 2025.
Figures current as of July 2026.
Disclaimer
This article is for educational and informational purposes only. It does not constitute medical, clinical, legal, or financial advice, and reading it does not create a therapist-client relationship with Matthew Sexton, LCSW or Mental Wealth Solutions, Inc. Although the author is a licensed clinical social worker, the content in this article is not clinical assessment, diagnosis, or treatment.
The statistics, policy details, and market patterns described here reflect published sources and are accurate as of their stated publication dates. Conditions change; verify current figures against the linked sources before relying on them. For decisions about your specific situation, consult the relevant professional, licensing board, or qualified legal or financial counsel.
If you are in immediate emotional crisis, you can reach the 988 Suicide & Crisis Lifeline by calling or texting 988 (US). If you are experiencing domestic violence or are in physical danger, contact the National Domestic Violence Hotline at 1-800-799-7233 or visit thehotline.org. In a life-threatening emergency, call 911.
Frequently asked questions.
- Which states have the worst mental health provider shortage?
- By HRSA's percent-of-need-met measure, the worst-off states as of December 31, 2025 are West Virginia (5.7% of need met), Delaware (7.0%), Arizona (10.1%), Alaska (12.2%), North Carolina (12.5%), and Tennessee (13.3%). Nationally, designated shortage areas meet only 27.3% of the need for mental health providers, and 137 million Americans live inside one.
- What does 'percent of need met' mean for a mental health HPSA?
- HRSA calculates percent of need met by dividing the mental health providers available inside a state's designated shortage areas by the number that would be required to lift those designations. A figure of 27.3% nationally means designated areas have roughly a quarter of the providers they would need to no longer count as shortage areas. The figure describes the designated shortage pockets, not a state's overall provider density.
- Which states have the biggest mental health workforce gap?
- By raw headcount, the largest gaps as of December 31, 2025 are in Texas (606 additional practitioners needed to lift its designations), California (598), and Florida (545), driven by population size. Alaska, by contrast, holds 338 shortage designations but needs only about 22 more practitioners because its designated populations are small.
- How do I find out how bad the therapist shortage is in my state?
- HRSA's Designated HPSA statistics at data.hrsa.gov and KFF's State Health Facts both publish per-state figures for the number of mental health shortage-area designations, the population inside them, and the percent of need met. Read the percent-of-need-met number as the supply picture inside designated pockets, and pair it with an access measure like Mental Health America's ranking, which folds in insurance coverage and cost.
- Does having providers nearby mean I can get an appointment?
- No. HRSA shortage data measures whether providers physically exist near a population. It does not measure whether they take your insurance, are accepting new patients, or are affordable. New York meets only 15.2% of its designated workforce need yet ranks 8th for access; Texas meets 32.2% of need yet ranks last (51st) for access. A provider on the map is not the same as a reachable appointment.
Want to discuss this for your program?
Book a 30-min conversation. We'll walk you through deployment, the BAA, and what your rollout looks like in production.
Book a 30-min conversation